
Microsoft Excel is a spreadsheet program used to organize information, perform calculations, analyze data, prepare reports, create charts, manage lists, and automate repetitive work. A strong understanding of Excel can help students with assignments, teachers with records, job aspirants with computer-skill preparation, and professionals with everyday office tasks. This MS Excel Guide explains Excel from basic concepts to useful formulas, functions, tables, sorting, filtering, charts, printing, data analysis, and practical shortcuts in simple language.
For beginners, Excel may initially look like a large grid of rows and columns. However, once you understand how a workbook, worksheet, cell, formula, function, and range work together, the program becomes much easier to use. Instead of memorizing hundreds of commands, learners should first understand the basic structure and then practice common tasks repeatedly.
This guide is designed as a complete learning resource. It covers foundational Excel concepts as well as techniques that are useful for school and college projects, competitive examinations, office work, data entry, accounting-related tasks, basic data analysis, and personal record keeping.
What Is MS Excel?
Microsoft Excel is a spreadsheet application designed to store, organize, calculate, and analyze data. Information is entered into cells arranged in rows and columns. Users can perform calculations with formulas, apply built-in functions, sort and filter records, create charts, and format information for reports.
A spreadsheet is particularly useful when data is structured in a table-like form. For example, a student can maintain marks for different subjects, a teacher can record attendance, a small business can maintain sales records, and an office worker can track expenses or employee information.
Excel is different from a simple text editor because it understands relationships between numerical values. When a formula refers to other cells, changing the source data can automatically update the result.
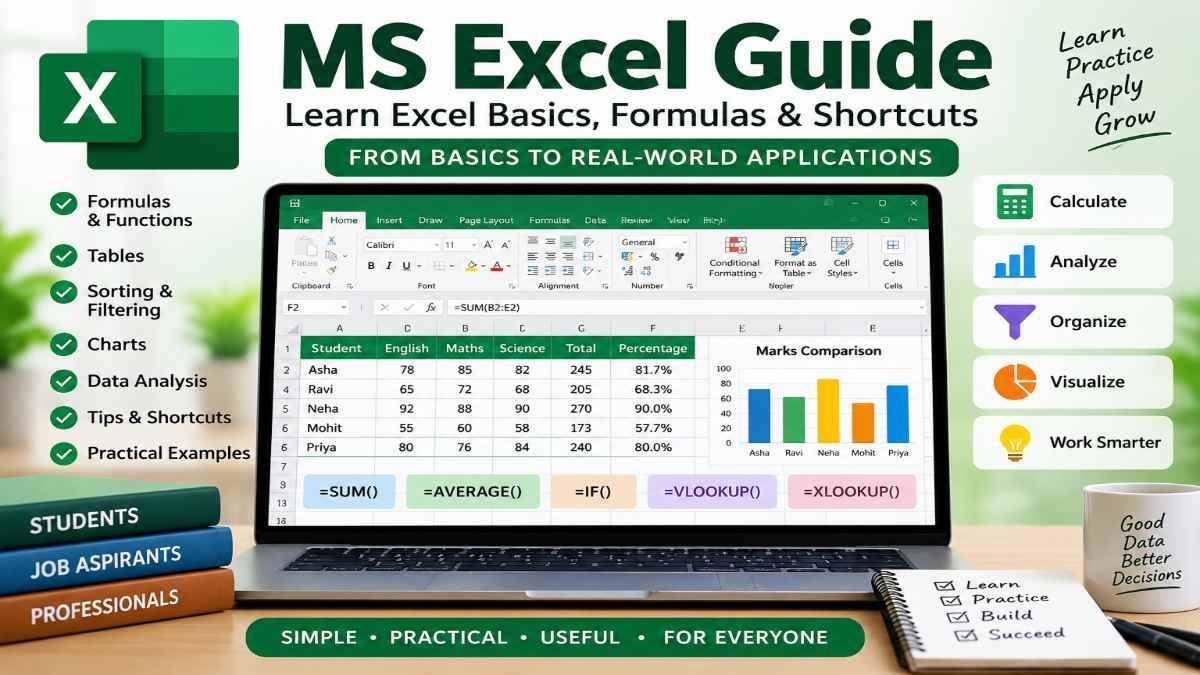
Excel Basic Functions: Complete Guide, Formulas, Examples & Tips
Common Uses of Excel
Excel can be used for many everyday tasks, including:
- Preparing student marksheets
- Creating attendance records
- Maintaining monthly budgets
- Calculating percentages and totals
- Managing inventories
- Preparing salary or expense sheets
- Creating invoices
- Analyzing survey data
- Creating charts and graphs
- Sorting large lists
- Filtering specific records
- Preparing office reports
- Tracking project progress
- Maintaining customer or employee records
The exact features available can depend on the Excel version and the Microsoft 365 environment being used.
Understanding the Excel Interface
Before learning formulas, it is useful to understand the main parts of the Excel window. Knowing these terms makes tutorials, classroom instructions, and computer-based questions easier to follow.
| Excel Element | Meaning |
|---|---|
| Workbook | The complete Excel file |
| Worksheet | An individual spreadsheet inside a workbook |
| Row | Horizontal series of cells identified by numbers |
| Column | Vertical series of cells identified by letters |
| Cell | The individual box where data is entered |
| Cell Address | The location of a cell, such as A1 |
| Range | A group of cells, such as A1:C10 |
| Formula Bar | Area where cell content or formulas can be viewed and edited |
| Name Box | Displays the address of the active cell |
| Ribbon | Contains commands organized into tabs |
| Sheet Tab | Used to move between worksheets |
| Status Bar | Displays information about the current selection and workbook |
Workbook vs Worksheet
A workbook is the Excel file itself. A workbook can contain one or more worksheets.
For example, a file named College_Record.xlsx is a workbook. Inside it, you might create separate worksheets named:
- Students
- Attendance
- Marks
- Fees
This structure helps keep related information organized in one file.
Rows and Columns
Rows run horizontally and are identified by numbers such as 1, 2, 3, and so on.
Columns run vertically and are identified by letters such as A, B, C, and so on.
The intersection of a row and a column creates a cell. For example, the intersection of column B and row 5 is B5.
What Is a Cell Address?
A cell address identifies the location of a specific cell.
Examples include:
- A1
- B4
- D10
- H25
The letter represents the column and the number represents the row.
When a formula uses a cell address, Excel uses the value stored in that cell for the calculation.
How to Enter Data in Excel
Entering information into Excel is simple. Select a cell, type the required value, and press Enter.
Excel can store different types of information.
Text
Examples:
- Rahul
- Mathematics
- Delhi
- Employee Name
Text is commonly used for names, descriptions, categories, and labels.
Numbers
Examples:
- 500
- 78
- 12.50
- 2026
Numbers can be used in mathematical calculations.
Dates
Examples:
- 21/09/2026
- 15-Aug-2026
Excel can recognize many date formats and use recognized dates in calculations and sorting.
Percentages
Examples:
- 25%
- 72.5%
Percentages are useful for marks, discounts, growth rates, attendance, commission, and other calculations.
Formulas
A formula is an expression used to calculate a result. Excel formulas normally begin with an equals sign.
For example:
=A1+B1
If A1 contains 50 and B1 contains 30, the result is 80.
What Is a Formula in Excel?
A formula is a user-created calculation that tells Excel what operation to perform. Formulas can use numbers, cell references, operators, and functions.
Common operators include:
| Operator | Purpose | Example |
|---|---|---|
| + | Addition | =A1+B1 |
| – | Subtraction | =A1-B1 |
| * | Multiplication | =A1*B1 |
| / | Division | =A1/B1 |
| ^ | Power | =A1^2 |
| % | Percentage | =A1*10% |
Simple Formula Example
Suppose:
- A2 contains 100
- B2 contains 50
To add them, enter:
=A2+B2
To subtract:
=A2-B2
To multiply:
=A2*B2
To divide:
=A2/B2
Why Cell References Are Better Than Typing Numbers Repeatedly
Suppose a student’s marks are entered in B2, C2, D2, E2, and F2. Instead of manually adding the numbers every time, you can use:
=SUM(B2:F2)
When any mark changes, the total can update automatically.
This is one of the most important ideas for beginners: use cell references so your calculations remain connected to your data.
Important Excel Functions Every Beginner Should Know
Excel contains many built-in functions. A function is a predefined formula that performs a particular type of calculation.
SUM Function
The SUM function adds values together.
Example:
=SUM(A1:A10)
This adds all numeric values from A1 through A10.
A practical example is calculating total monthly expenses.
AVERAGE Function
The AVERAGE function calculates the arithmetic average of numbers.
Example:
=AVERAGE(B2:B6)
If B2:B6 contains five subject marks, this formula calculates the average.
MAX Function
MAX returns the largest value.
Example:
=MAX(C2:C20)
This can be used to find the highest marks in a class list.
MIN Function
MIN returns the smallest value.
Example:
=MIN(C2:C20)
It can help identify the lowest value in a dataset.
COUNT Function
COUNT counts cells containing numeric values.
Example:
=COUNT(A1:A20)
It is useful when you want to know how many cells in a range contain numbers.
COUNTA Function
COUNTA counts non-empty cells, including cells containing text.
Example:
=COUNTA(A1:A20)
This can be useful for counting filled records.
IF Function
The IF function returns one result when a condition is true and another when it is false.
Example:
=IF(B2>=40,"Pass","Fail")
If B2 is 40 or more, Excel displays “Pass”; otherwise it displays “Fail”.
IF is especially useful for eligibility checks, result sheets, attendance conditions, and status labels.
IFERROR Function
IFERROR can display an alternative result when a formula produces an error.
Example:
=IFERROR(A2/B2,0)
Instead of displaying an error when the division cannot be calculated, the formula returns 0.
Use this carefully because hiding an error is not the same as fixing its underlying cause.
Relative, Absolute and Mixed References
Cell references become especially important when formulas are copied.
Relative Reference
A reference such as:
A1
is relative. When the formula is copied to another location, the reference normally changes according to its new position.
For example:
=A2+B2
copied one row downward can become:
=A3+B3
Absolute Reference
An absolute reference does not change when copied.
Example:
=$F$1
The dollar signs lock both the column and row.
This is useful when a formula needs to refer to one fixed value, such as a tax rate or discount percentage stored in one cell.
Mixed Reference
A mixed reference locks either the row or the column.
Examples:
=$A1
and
=A$1
Mixed references become useful in structured calculation tables where formulas are copied both across columns and down rows.
Using the Fill Handle
The fill handle is a small control that appears near the lower-right corner of a selected cell or range. It can be used to copy formulas, continue sequences, and fill data.
For example, if A1 contains January and A2 contains February, Excel can often continue the sequence when the fill handle is dragged.
For formulas, the fill handle can quickly copy a formula down a column while adjusting relative references automatically.
This is much faster than entering the same formula manually in every row.
Sorting Data in Excel
Sorting arranges data according to a selected order.
For numerical data, you may sort from smallest to largest or largest to smallest.
For text data, you can sort alphabetically.
For example, a student database may contain:
| Name | Marks |
|---|---|
| Amit | 72 |
| Neha | 91 |
| Ravi | 68 |
Sorting by marks from largest to smallest produces a different order based on the numerical values.
Why Sorting Is Useful
Sorting helps when working with:
- Student marks
- Employee names
- Sales values
- Dates
- Product quantities
- Application records
- Transaction lists
Before sorting a dataset, make sure the relevant rows are kept together. Accidentally sorting only one column can separate values from their corresponding records.
Filtering Data in Excel
Filtering allows you to temporarily display only records that meet selected conditions.
Suppose a table contains students from different cities. A filter can be used to show only students from a particular city without deleting the other records.
Filters are valuable when a worksheet contains many rows and you need to focus on a smaller subset.
Common filtering conditions include:
- Specific text
- Specific numbers
- Dates
- Greater than or less than a value
- Values beginning with particular text
- Multiple selected items
Filtering does not normally delete hidden records; it changes what is displayed.
Excel Tables
An Excel Table is a structured way to manage a range of related data.
Instead of treating your dataset as an ordinary cell range, you can convert it into a table. Tables can provide useful features such as structured references, automatic expansion, filtering, and consistent formatting.
For example, you might create a table with columns such as:
| Student ID | Name | Class | Marks | Result |
|---|---|---|---|---|
| 101 | Asha | 10 | 87 | Pass |
| 102 | Mohit | 10 | 36 | Fail |
Tables become especially useful when new records are added regularly.
How to Create a Simple Marksheet
Creating a marksheet is one of the best ways for beginners to learn Excel.
Suppose the headings are:
| Student | English | Maths | Science | Total | Average |
|---|---|---|---|---|---|
| Asha | 78 | 85 | 82 |
In the Total column, enter:
=SUM(B2:D2)
In the Average column, enter:
=AVERAGE(B2:D2)
Then use the fill handle to copy the formulas down for additional students.
You can also create a Result column using:
=IF(E2>=120,"Pass","Fail")
The exact passing rule should be based on the grading or assessment system being used. If separate minimum marks are required for each subject, a more detailed condition should be created instead of checking only the total.
How to Calculate Percentage in Excel
Suppose a student has obtained 420 marks out of 500.
A percentage formula can be written as:
=420/500*100
When the obtained marks are stored in A2 and maximum marks in B2:
=A2/B2*100
A common improvement is to format the result appropriately rather than unnecessarily multiplying by 100 when using Excel’s Percentage number format.
Understanding the distinction between the underlying decimal value and percentage display is important. For example, 0.75 displayed as Percentage becomes 75%.
Formatting in Excel
Formatting changes how information appears without necessarily changing the underlying value.
Common formatting options include:
- Font type
- Font size
- Bold
- Italic
- Underline
- Text alignment
- Cell borders
- Fill
- Number format
- Decimal places
- Date format
- Percentage format
Number Formatting
Number formatting is particularly important for professional spreadsheets.
A value can be displayed as:
- General number
- Currency
- Percentage
- Date
- Time
- Decimal number
Changing the format does not necessarily change the underlying numeric value. This distinction is important when calculations are involved.
Wrap Text
Wrap Text displays long text across multiple lines within the same cell.
It is helpful when column widths are limited and you do not want long headings to extend into neighboring cells.
Merge and Center
Merge & Center combines selected cells into one larger cell and centers the content.
It can be useful for titles, but it should be used carefully. Merged cells can make sorting, filtering, and data manipulation more difficult when they are placed inside the main data area.
Conditional Formatting
Conditional formatting automatically changes the appearance of cells based on rules.
For example, you can highlight:
- Marks below a certain value
- High sales figures
- Duplicate values
- Overdue dates
- Negative numbers
- Specific text
This is useful because patterns become easier to identify visually without manually checking every value.
For example, in a marksheet, conditional formatting could highlight students whose marks are below a selected threshold.
Creating Charts in Excel
Charts convert numerical information into visual form. They can make trends, comparisons, and patterns easier to understand.
Common chart types include:
| Chart Type | Suitable Use |
|---|---|
| Column Chart | Comparing categories |
| Bar Chart | Comparing values, especially when labels are long |
| Line Chart | Showing trends over time |
| Pie Chart | Showing parts of a whole when categories are limited |
| Area Chart | Showing trends and accumulated values |
| Scatter Chart | Examining relationships between numerical variables |
Example of a Column Chart
Suppose you have monthly sales:
| Month | Sales |
|---|---|
| January | 40000 |
| February | 52000 |
| March | 47000 |
| April | 61000 |
A column chart can make month-to-month comparison easier.
Choosing the Right Chart
The chart should match the question being asked.
Use a line chart when the primary focus is a trend over time. Use columns or bars when comparing categories. Avoid using a complicated chart when a simple chart communicates the information more clearly.
A chart should support the data rather than distract from it.
Find and Replace
Find and Replace is useful when the same text or value appears in many places.
For example, suppose “Himachal Pardesh” has been entered incorrectly in several cells and needs to be changed to “Himachal Pradesh.” Find and Replace can make the correction much faster than editing every cell individually.
It can also be used for replacing:
- Words
- Phrases
- Numbers
- Formatting in certain workflows
Always review replacements carefully when the searched text could appear in multiple contexts.
Freeze Panes
Freeze Panes keeps selected rows or columns visible while you scroll.
This is extremely useful for large datasets.
For example, a worksheet may have hundreds of rows and a header row containing:
Name | ID | Department | Salary | Date
When scrolling down, the header can remain visible so you know which column contains which information.
Data Validation
Data Validation can control what users are allowed to enter in a cell.
For example, a cell can be configured to accept:
- A number within a range
- A date within a specified period
- A selected item from a drop-down list
- Text meeting a specified condition
A drop-down list is especially useful for fields such as:
- Gender
- Department
- Status
- Yes/No
- Payment Status
This reduces inconsistent entries and improves data quality.
Using Excel for Data Analysis
Excel can be used for basic and moderately advanced data analysis.
A sensible process is:
- Enter or import the data.
- Check for missing or incorrect values.
- Format the dataset consistently.
- Convert the range to a table where appropriate.
- Sort and filter records.
- Use formulas and functions.
- Create charts or summaries.
- Review the results.
- Present the information clearly.
Good analysis begins with clean data. A sophisticated formula cannot compensate for inaccurate or poorly structured source data.
Lookup Functions in Excel
Lookup functions are used to find related information from a table or range.
VLOOKUP
VLOOKUP searches for a value in the first column of a selected table and returns related information from another column.
A typical structure is:
=VLOOKUP(A2,$F$2:$H$20,3,FALSE)
The exact arguments depend on the dataset.
VLOOKUP is commonly taught in Excel courses and remains useful for many legacy spreadsheets.
XLOOKUP
XLOOKUP is a newer lookup function available in supported Excel versions. It offers more flexible lookup behavior than traditional VLOOKUP in many situations.
A simple example is:
=XLOOKUP(A2,F2:F20,H2:H20,"Not Found")
It looks for the value from A2 in F2:F20 and returns the corresponding value from H2:H20.
Because Excel versions differ, users of older releases should check whether XLOOKUP is supported in their environment.
INDEX and MATCH
INDEX and MATCH are two functions that can be combined for flexible lookup operations.
A typical pattern is:
=INDEX(C2:C20,MATCH(A2,A2:A20,0))
The exact formula should be adapted to the actual structure of the dataset.
Learning multiple lookup approaches is valuable because real-world spreadsheets may use different techniques.
Useful Text Functions
Excel is not limited to numerical calculations. It also provides functions for handling text.
LEFT
LEFT returns a specified number of characters from the beginning of text.
Example:
=LEFT(A2,3)
RIGHT
RIGHT returns characters from the end of text.
Example:
=RIGHT(A2,4)
LEN
LEN returns the number of characters in a text value.
Example:
=LEN(A2)
TRIM
TRIM can help remove unnecessary extra spaces from text.
Example:
=TRIM(A2)
CONCAT and TEXTJOIN
These functions can combine text from different cells.
For example:
=CONCAT(A2," ",B2)
can join a first name and last name with a space.
TEXTJOIN is useful when multiple text values need to be combined using a chosen delimiter.
Common Mathematical and Logical Functions
As your Excel skills improve, several additional functions become useful.
ROUND
ROUND rounds a number to a specified number of digits.
Example:
=ROUND(A2,2)
ROUNDUP and ROUNDDOWN
These functions provide more specific control over rounding direction.
COUNTIF
COUNTIF counts cells that meet a condition.
Example:
=COUNTIF(B2:B50,">=40")
This can count how many values are 40 or above.
SUMIF
SUMIF adds values that meet a specified condition.
Example:
=SUMIF(A2:A20,"North",C2:C20)
This can total values associated with a particular category.
COUNTIFS and SUMIFS
The plural versions can apply multiple conditions.
They are useful for questions such as:
- How many students from Class 10 scored above a certain mark?
- What are the total sales for a specific region and month?
- How many applications have a selected status?
PivotTables in Excel
A PivotTable is an Excel feature used to summarize and analyze larger datasets without manually constructing every summary formula.
Suppose a sales dataset contains:
Date | Region | Product | Salesperson | Sales
A PivotTable can summarize sales by:
- Region
- Product
- Salesperson
- Month
- Multiple combinations of fields
PivotTables are especially useful when you want to explore the same dataset from different perspectives.
For beginners, the key idea is simple: a PivotTable helps turn detailed rows of data into meaningful summaries.
Introduction to Advanced Dynamic Functions
Some supported Excel versions provide dynamic-array functions that can return multiple results from a single formula.
Examples include:
FILTER
SORT
UNIQUE
For example:
=FILTER(A2:C100,C2:C100="Pass")
can return records meeting the specified condition in Excel environments that support the function.
Similarly:
=UNIQUE(A2:A100)
can return unique entries from a range.
These newer functions can reduce the need for complicated manual formulas, but availability depends on the Excel version or Microsoft 365 environment.
Working With Multiple Worksheets
Larger Excel workbooks often contain several worksheets. You can use separate sheets for different categories of information.
For example:
- Sheet 1: Student Details
- Sheet 2: Marks
- Sheet 3: Attendance
- Sheet 4: Fee Details
A formula can refer to another sheet.
For example:
=Marks!B2
This references cell B2 on the worksheet named Marks.
When a sheet name contains spaces, Excel may use quotation marks around the name, such as:
='Student Data'!B2
Organizing a workbook logically makes it easier to maintain and update.
Printing an Excel Worksheet
A spreadsheet that looks good on the screen may not automatically print well. Before printing, check:
- Page orientation
- Paper size
- Margins
- Scaling
- Print area
- Page breaks
- Repeated headers where appropriate
- Whether columns are being cut off
For a wide table, landscape orientation may sometimes be more appropriate. For a narrow form, portrait orientation may be sufficient.
Always use Print Preview before printing an important worksheet.
Protecting Excel Data
Excel provides protection features that can help prevent accidental modifications.
For example, you may want users to enter information in selected cells while keeping formula cells protected.
Possible protection approaches can include:
- Protecting a worksheet
- Protecting selected cells through sheet protection settings
- Protecting workbook structure
- Using passwords where appropriate
Protection should not be confused with a guarantee that sensitive information is completely secure. For highly confidential data, use suitable organizational security controls in addition to spreadsheet protection features.
Common Excel Errors and Their Meaning
Beginners often become confused when Excel displays an error instead of a result.
| Error | General Meaning |
|---|---|
| #DIV/0! | A formula attempts division by zero or an empty denominator |
| #N/A | A required value is not available, often in lookup operations |
| #VALUE! | An argument or data type is inappropriate for the operation |
| #REF! | A formula contains an invalid cell reference |
| #NAME? | Excel does not recognize a name or function in the formula |
| #NUM! | A formula has an invalid numerical result or argument |
| #SPILL! | A dynamic-array result cannot expand into the required cells |
The exact cause should be investigated rather than simply hiding the error.
Most Useful Excel Keyboard Shortcuts
Keyboard shortcuts can make Excel work faster, especially for repeated office tasks and computer-based examinations.
| Shortcut | Function |
|---|---|
| Ctrl + C | Copy |
| Ctrl + X | Cut |
| Ctrl + V | Paste |
| Ctrl + Z | Undo |
| Ctrl + Y | Redo |
| Ctrl + S | Save |
| Ctrl + F | Find |
| Ctrl + H | Find and Replace |
| Ctrl + A | Select data/current region depending on context |
| Ctrl + P | |
| Ctrl + B | Bold |
| Ctrl + I | Italic |
| Ctrl + U | Underline |
| Ctrl + 1 | Open Format Cells |
| F2 | Edit the active cell |
| Alt + = | Insert AutoSum |
| Ctrl + Arrow Key | Move quickly through data regions |
| Shift + Space | Select row |
| Ctrl + Space | Select column |
The behavior of some shortcuts can vary depending on the current selection and Excel environment.
Important MS Excel Shortcuts for Competitive Exams
Excel-related questions in computer-awareness sections often focus on basic terminology, functions, and shortcuts rather than highly advanced analysis.
Candidates should be comfortable with:
- Workbook and worksheet definitions
- Row and column concepts
- Cell references
- Formula basics
- Common functions
- Sorting and filtering
- Charts
- Copy, cut, paste
- Save and print commands
- Relative and absolute references
- Basic shortcut keys
A useful exam strategy is to understand the purpose of a command instead of memorizing isolated terms.
For example, remember:
SUM → Adds
AVERAGE → Finds average
MAX → Largest
MIN → Smallest
COUNT → Counts numbers
IF → Tests a condition
VLOOKUP/XLOOKUP → Finds related information
This conceptual association can make revision easier.
Practical MS Excel Projects for Students
The best way to learn Excel is to practice with realistic datasets.
Student Marks Management
Create columns for:
Name | Roll Number | English | Maths | Science | Total | Percentage | Result
Practice:
- SUM
- AVERAGE
- IF
- Percentage formatting
- Conditional formatting
- Sorting
Monthly Budget
Create:
Date | Category | Description | Amount
Then calculate category totals using functions such as SUMIF or SUMIFS.
Attendance Sheet
Create:
Name | Working Days | Present | Absent | Attendance %
Then calculate attendance percentage and use conditional formatting to identify lower attendance values.
Personal Expense Tracker
Create categories such as:
- Food
- Travel
- Education
- Bills
- Shopping
- Other
Use a chart to understand where money is being spent.
Simple Sales Report
Create:
Date | Product | Quantity | Price | Total
Use:
=Quantity*Price
to calculate total value.
Then create a summary using SUMIFS or a PivotTable.
Advantages of Learning Excel
Learning Excel provides several practical benefits.
Faster Calculations
Instead of manually calculating totals, averages, percentages, and other values, formulas can perform the work automatically.
Better Data Organization
Structured worksheets make information easier to find, update, filter, and review.
Easier Reporting
Charts, formatted tables, and summary calculations can turn raw data into a readable report.
Reduced Repetitive Work
Formulas, fill operations, tables, and other tools can reduce repetitive manual entry.
Transferable Computer Skills
Excel skills are useful in education, administration, finance-related work, sales, operations, data entry, research, and many other settings.
Limitations and Challenges of Excel
Excel is powerful, but it is not the ideal tool for every situation.
Large or poorly designed workbooks can become difficult to maintain. Manual data entry can introduce mistakes. Complex formulas may become difficult for another person to understand. Multiple users editing the same complicated spreadsheet can also create management challenges.
Excel should therefore be used with sensible structure, clear headings, consistent formatting, and careful validation.
For very large databases or highly specialized systems, dedicated database or analytics software may be more appropriate.
Common Mistakes Beginners Make in Excel
Typing Results Instead of Formulas
If a total can be calculated automatically, typing the final number manually increases the chance of errors.
Mixing Data Types
Entering dates, numbers, and text inconsistently can affect sorting and calculations.
Leaving Empty or Incorrect Rows Inside Data
Poorly structured datasets can cause problems with filtering, formulas, charts, and PivotTables.
Sorting Only One Column
Sorting one column without including the complete record can disconnect names from their corresponding marks, IDs, or other information.
Using Too Many Merged Cells
Merged cells can make data manipulation difficult, particularly inside structured datasets.
Not Checking Formulas
A formula may be syntactically correct but logically wrong. Always check whether it is calculating the intended result.
Using Incorrect Absolute References
When copying formulas, users sometimes forget to lock a fixed reference with $.
Ignoring Print Preview
Important reports may print with missing columns or awkward page breaks if the sheet is not configured correctly.
Practical Tips to Learn Excel Faster
Start with basic tasks rather than attempting advanced functions immediately.
A useful progression is:
Step 1: Learn rows, columns, cells, ranges, and worksheets.
Step 2: Practice entering and formatting data.
Step 3: Learn arithmetic formulas.
Step 4: Learn SUM, AVERAGE, COUNT, MAX, MIN, and IF.
Step 5: Practice sorting and filtering.
Step 6: Learn charts and conditional formatting.
Step 7: Understand relative and absolute references.
Step 8: Learn lookup functions.
Step 9: Practice PivotTables.
Step 10: Build complete mini-projects.
Regular practice is more effective than trying to memorize a large list of functions at once.
How Students Can Use Excel for Study
Students can use Excel for much more than marksheets.
A study planner can contain:
Date | Subject | Topic | Planned Hours | Actual Hours | Status
A revision tracker can record chapters and completion status.
A result calculator can show subject-wise marks, total marks, percentage, and status.
A project budget can track expected and actual expenses.
A research spreadsheet can organize survey responses or experimental observations.
These activities teach Excel while also improving basic data-management skills.
How Job Aspirants Can Use Excel
For job aspirants, Excel can be especially useful for practical office skills.
Common workplace tasks may include:
- Maintaining records
- Preparing lists
- Calculating totals
- Creating reports
- Filtering data
- Updating tables
- Tracking expenses
- Managing schedules
- Preparing summaries
- Creating charts
Candidates preparing for computer-awareness tests should also understand common Excel terminology and shortcuts.
The exact skills expected in a job depend on the role and organization.
Important Points to Remember
The following concepts form the foundation of Excel:
- A workbook is the Excel file, while a worksheet is a sheet inside it.
- A cell is identified by a column letter and row number.
- A range is a group of cells.
- Formulas normally begin with
=. - Functions are predefined formulas.
- Relative references can change when copied.
- Absolute references use
$to lock references. - Sorting changes the order of records.
- Filtering controls which records are displayed.
- Conditional formatting highlights data according to rules.
- Charts present numerical information visually.
- PivotTables summarize larger datasets.
- Data validation can restrict or standardize entries.
- Excel errors should be investigated instead of blindly hidden.
- Properly structured data is easier to analyze.
Frequently Asked Questions
What is MS Excel used for?
MS Excel is used to store, organize, calculate, analyze, and present data. Common uses include marksheets, budgets, reports, attendance records, inventories, expense tracking, charts, and data analysis.
Excel is useful because calculations can be linked to cell values. When source information changes, related formulas can recalculate the result.
Is MS Excel easy for beginners?
Yes. Beginners can learn Excel effectively by starting with cells, rows, columns, basic formatting, and simple formulas. After understanding those foundations, learners can gradually move to functions, sorting, filtering, charts, lookup functions, and PivotTables.
The difficulty usually increases with the complexity of the spreadsheet rather than with Excel itself.
What are the basic formulas in Excel?
Common beginner formulas include addition, subtraction, multiplication, and division using operators such as +, -, *, and /.
Common functions include SUM, AVERAGE, COUNT, MAX, MIN, IF, and IFERROR. These functions cover many everyday spreadsheet tasks.
What is the difference between a workbook and a worksheet?
A workbook is the complete Excel file. A worksheet is an individual spreadsheet contained inside the workbook.
One workbook can contain multiple worksheets, allowing related information to be organized separately.
What is a cell reference in Excel?
A cell reference identifies the location of a cell. For example, B5 refers to column B and row 5.
Cell references allow formulas to use values stored in other cells instead of requiring users to type those values manually.
What is the difference between relative and absolute reference?
A relative reference, such as A1, normally changes when a formula is copied to another location. An absolute reference, such as $A$1, remains fixed.
Absolute references are useful when a formula repeatedly needs to use one constant cell.
What is VLOOKUP used for?
VLOOKUP searches for a value in the first column of a selected table and returns information from another column in the same table.
It is often used to retrieve related data such as names, prices, departments, or other attributes based on an ID or key.
What is XLOOKUP in Excel?
XLOOKUP is a lookup function available in supported newer Excel environments. It can search for a value in one range and return the corresponding value from another range.
It provides flexible lookup options, but users working with older Excel versions should verify compatibility.
What is a PivotTable?
A PivotTable is a tool used to summarize and analyze data. Instead of manually calculating every category, users can arrange fields to create summaries such as total sales by region, product, or month.
PivotTables are particularly helpful when a dataset contains many records.
Can Excel calculate percentages?
Yes. Excel can calculate percentages through formulas and can also display values using Percentage number formatting.
For example, if obtained marks are in A2 and maximum marks are in B2, a basic percentage calculation can use =A2/B2*100, while percentage formatting can be used depending on how the result is intended to be displayed.
How can students learn Excel quickly?
Students should combine short lessons with practical exercises. Creating a marksheet, budget, attendance sheet, expense tracker, or simple sales report helps connect formulas with real tasks.
Learning a small group of frequently used functions and practicing them repeatedly is generally more useful than trying to memorize every available function.
Conclusion
Learning MS Excel Guide concepts step by step can turn a confusing grid of cells into a practical tool for calculations, organization, reporting, and data analysis. Beginners should first understand workbooks, worksheets, rows, columns, cells, ranges, formulas, and basic functions. Once these foundations are clear, features such as sorting, filtering, conditional formatting, charts, lookup functions, PivotTables, and data validation become much easier to learn.
For students, Excel can support marksheets, attendance records, study trackers, project budgets, and academic data. For job aspirants, it can strengthen practical computer skills required for many office-oriented tasks. The most effective way to become comfortable with Excel is consistent hands-on practice using realistic datasets.
An effective learning path is simple: master the basics, practice common formulas, understand references, work with structured data, learn analysis tools, and gradually move toward advanced functions. By doing so, learners can use Excel more accurately, efficiently, and confidently for both academic and practical work.
14 thoughts on “MS Excel Guide: Learn Excel Basics, Formulas, Functions & Shortcuts”